AtlasView road maintenance app with map, list and split views
AtlasView helps cities and engineering firms track roads and other assets, schedule inspections and treatments, and forecast road condition. I audited the existing web app and redesigned it end to end.
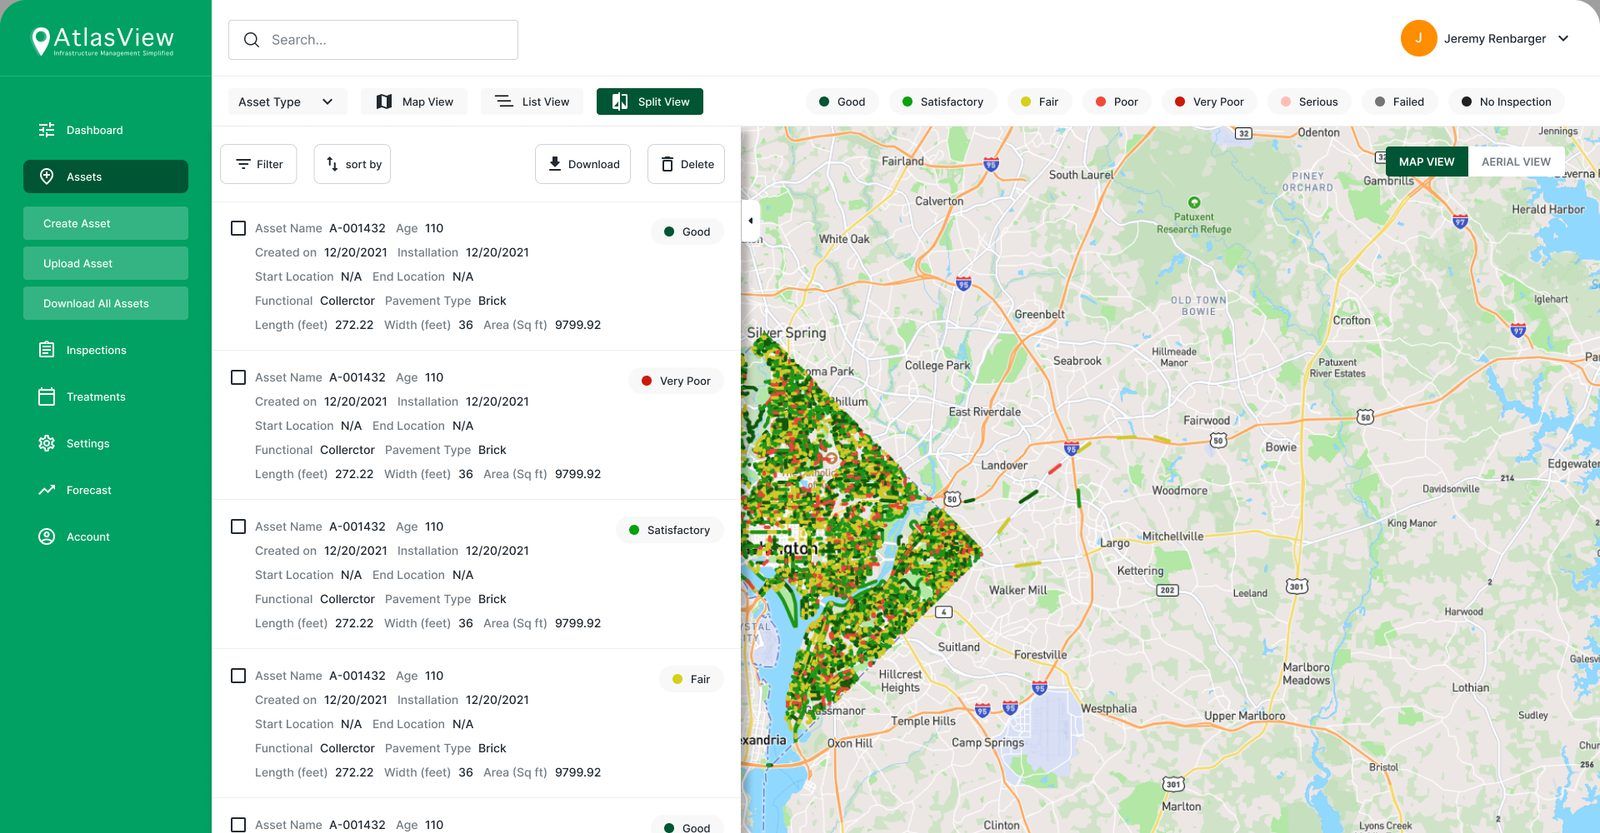
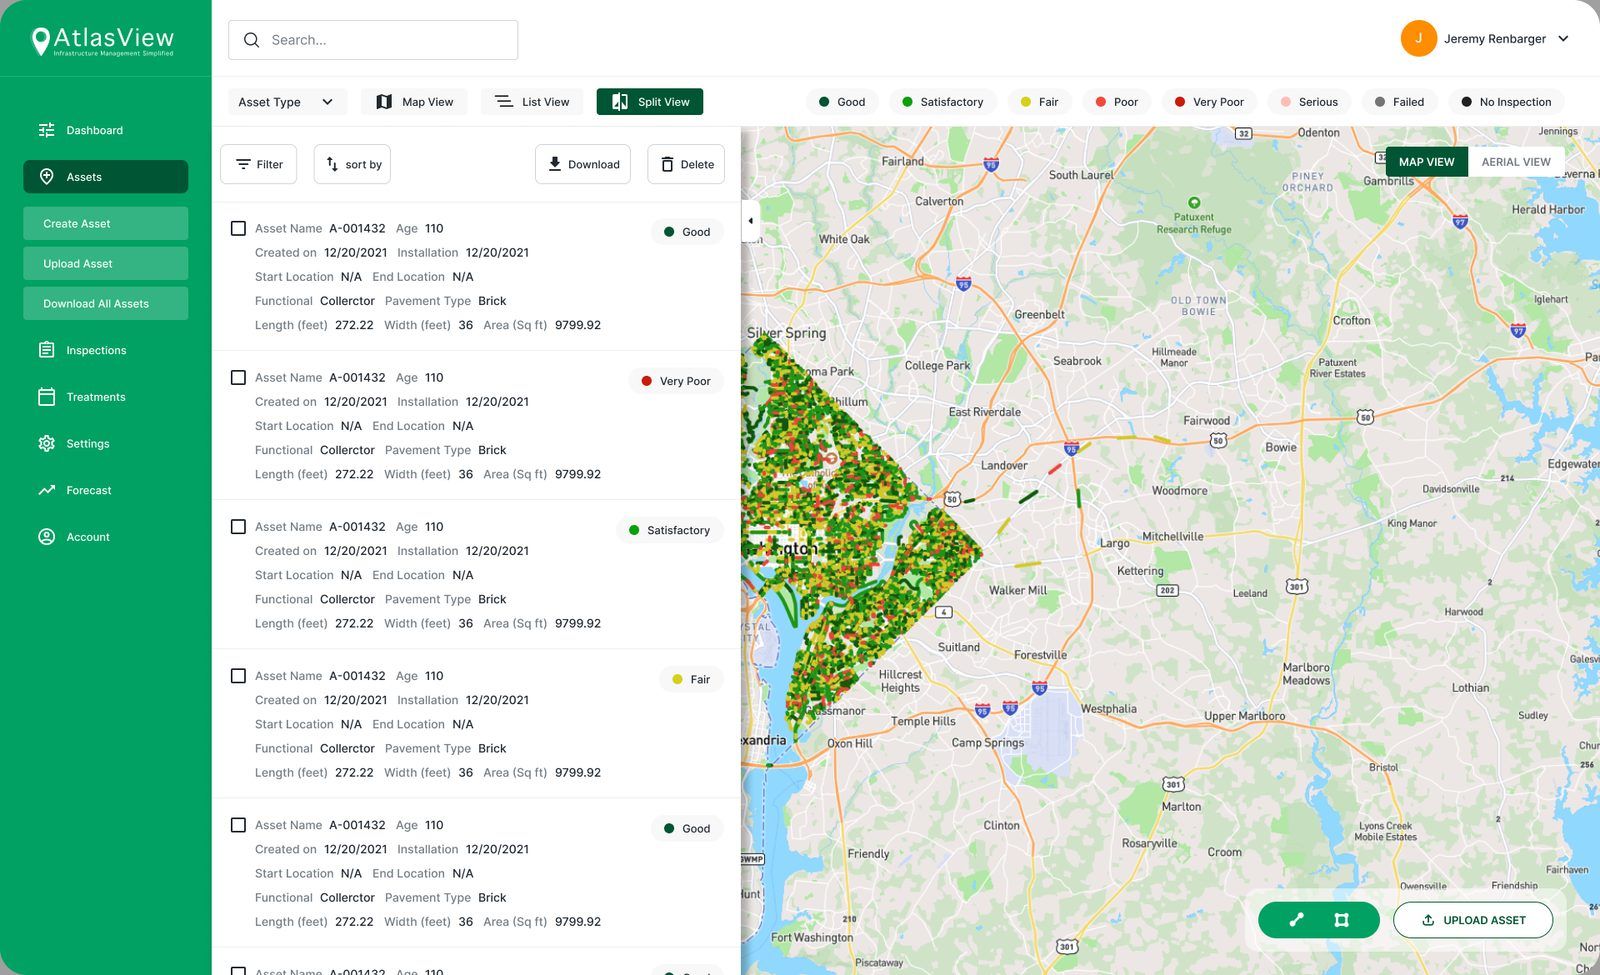
ways to see assets: map, list and split view
condition levels, color-coded from Good to Failed, used in every view
modules redesigned: dashboard, assets, inspections, treatments, settings, forecast
TL;DR
- Problem
- The map took up the whole screen and forms opened on top of it. There was no filter by condition, and switching between map and list lost the user's place.
- What I did
- Audited the app, looked at how Turo and Airbnb pair a list with a map, and redesigned the dashboard, assets, inspections, treatments, settings and forecast.
- Outcome
- The map and the data stay visible together in every module, and the engineering settings are now step-by-step forms.
1. Audit
AtlasView manages pavement networks. Every road segment is an asset with a type, size, age and a condition score from 0 to 100. Inspections update the score, treatments improve it, and the forecast shows how the network will age under a given budget.
I started by going through the existing app and writing down every point of friction. The main ones:
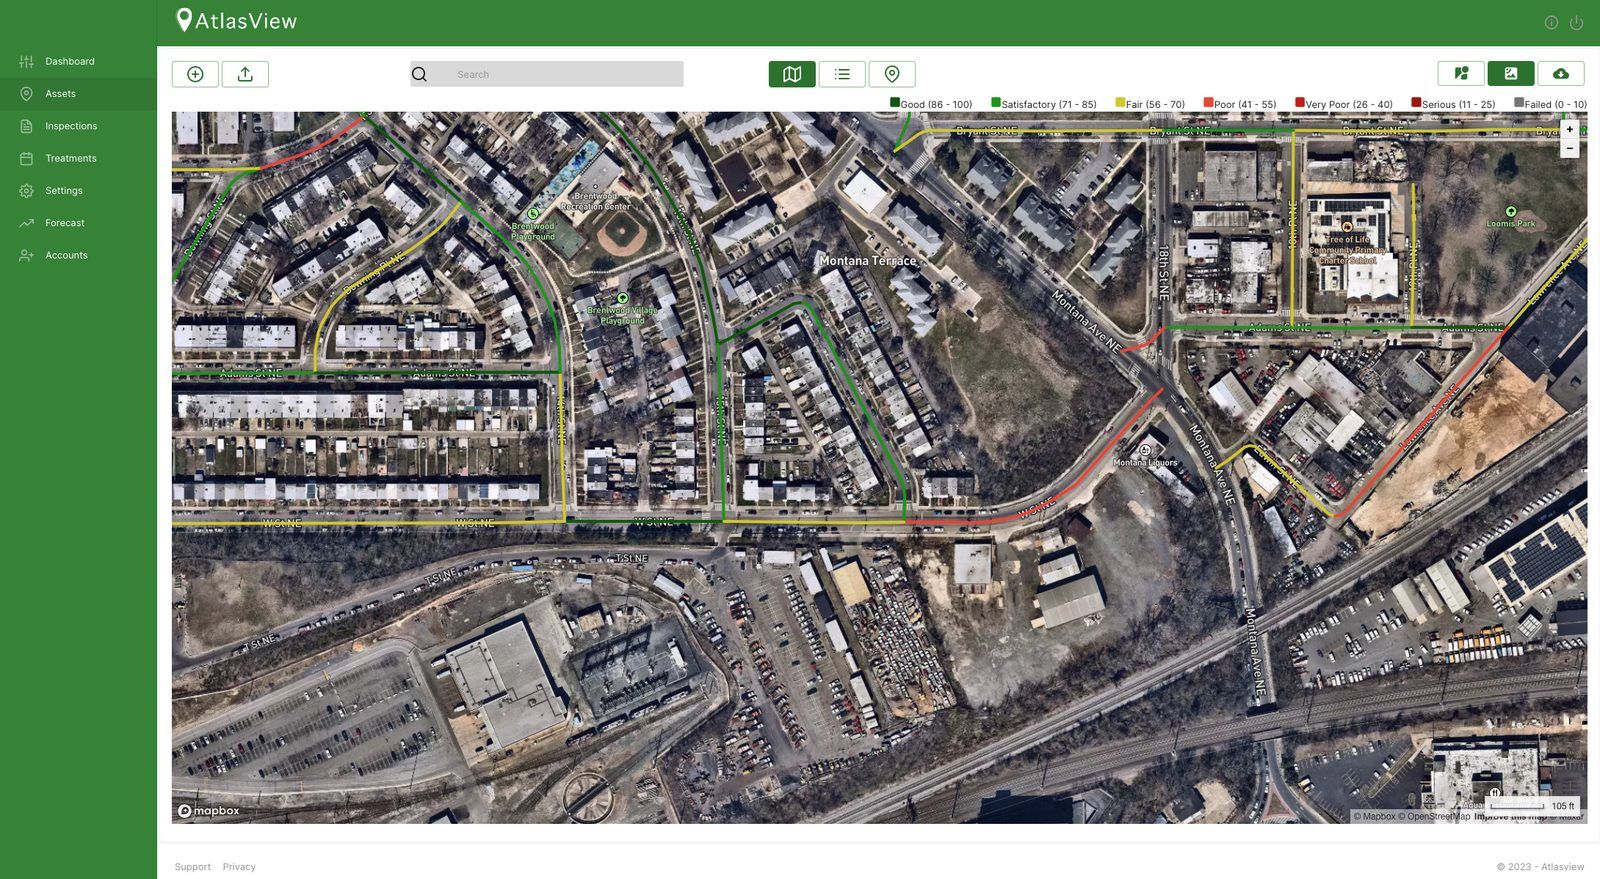
- The map was colored by condition, but you couldn't filter by it. Users could see red roads but not isolate them.
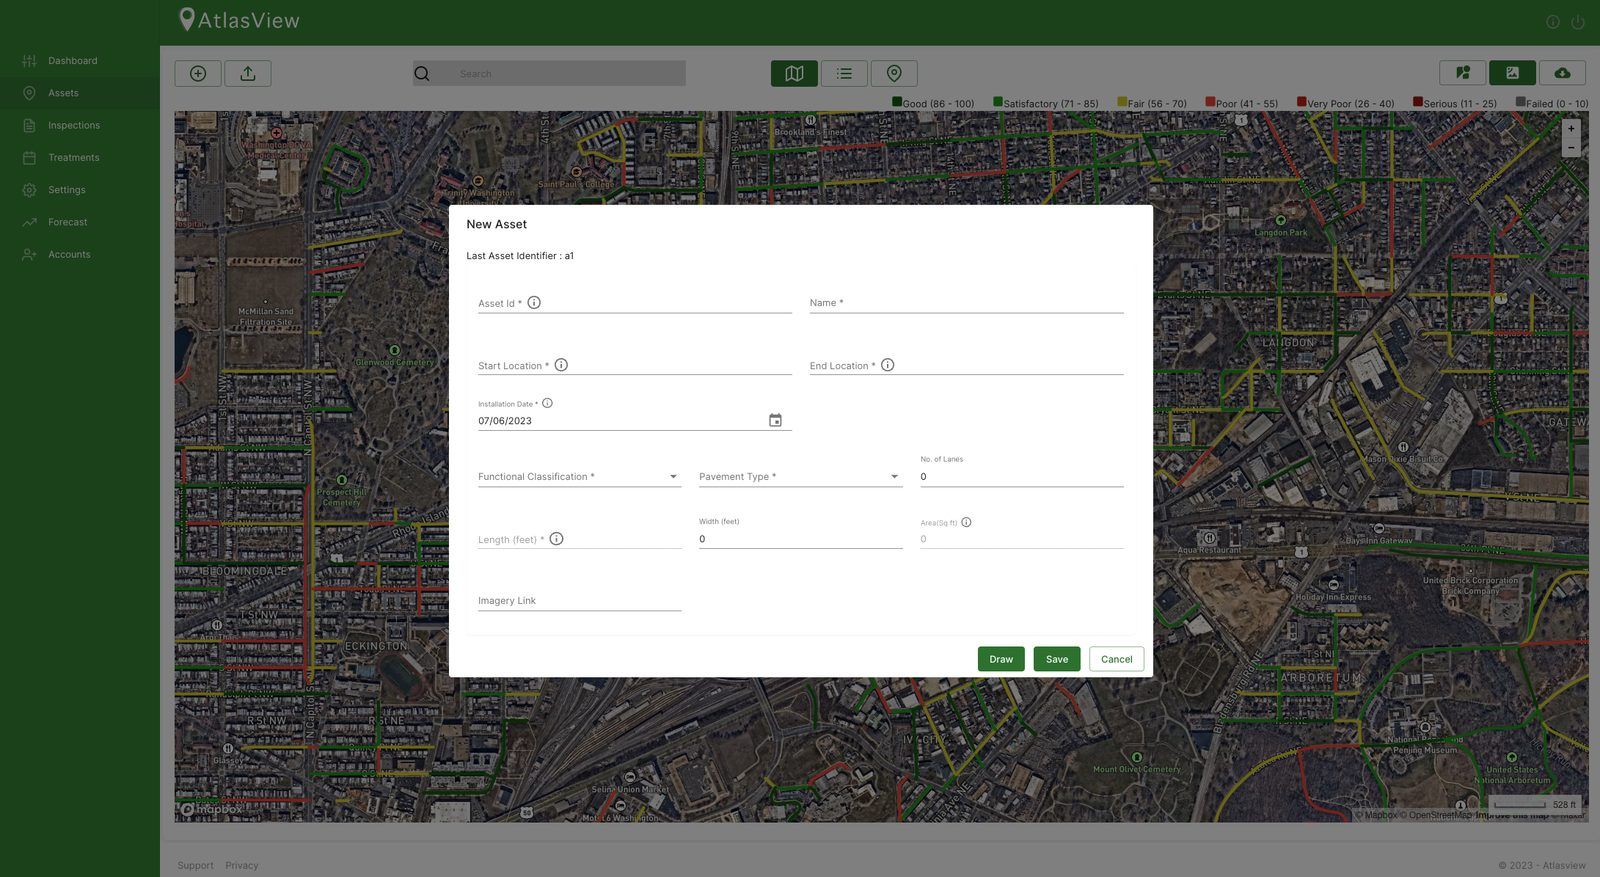
- Forms covered the map. Creating an asset opened a modal on top of the map, right when users needed the map to place it. After clicking "Draw" there was no way back to the form.
- Navigation lost context. Going back from an asset didn't return to the list view the user came from.
- Missing basics. No edit action on detail views, no autocomplete in search, and no search, date filter or sort on long lists.
2. References
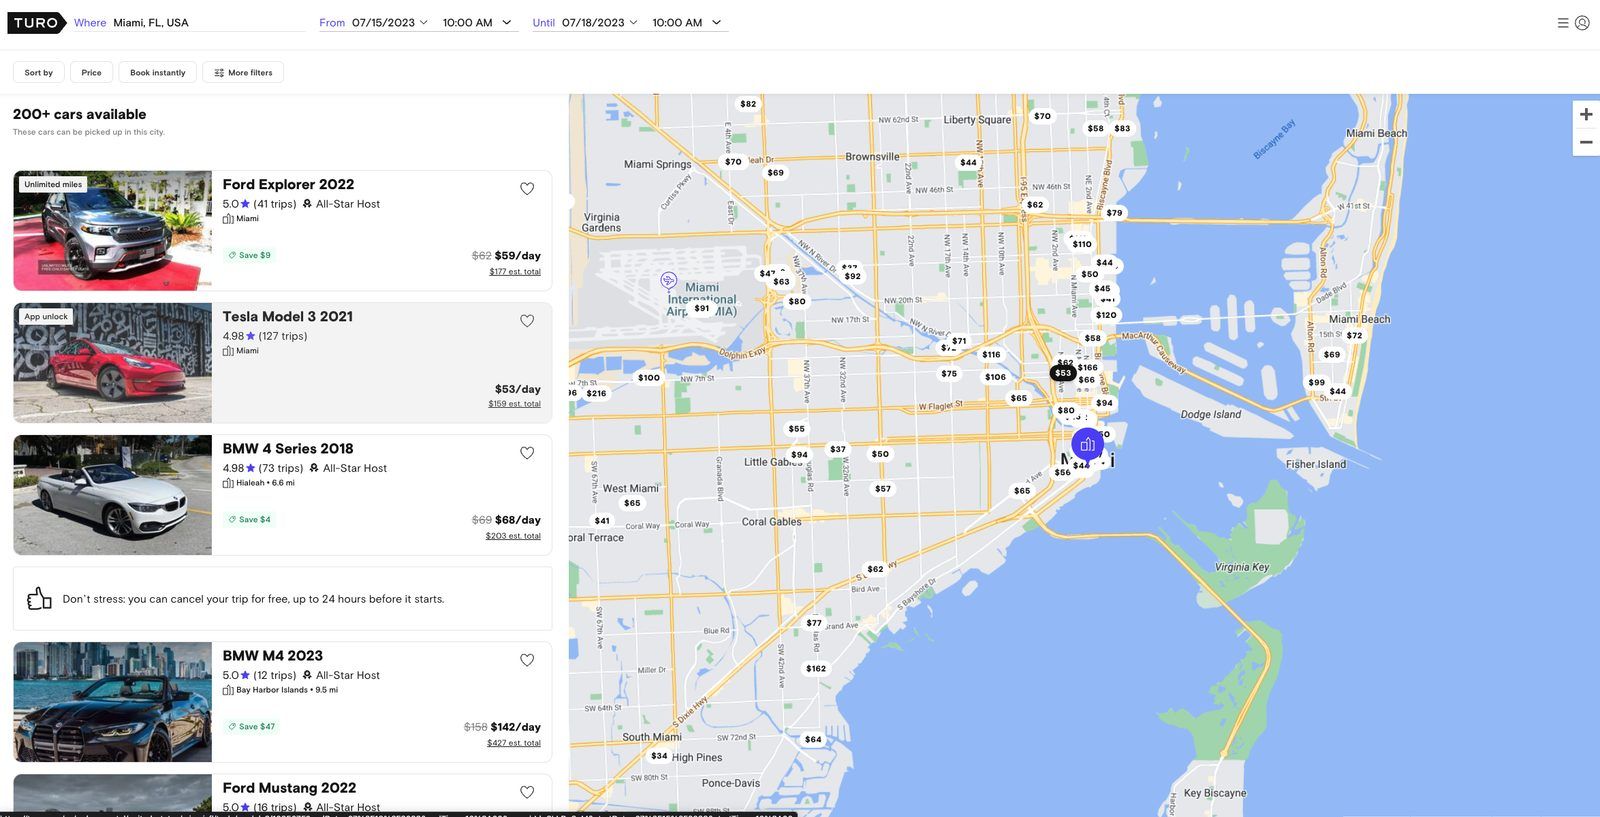
Turo and Airbnb have a similar problem. People browse a list and a map at the same time. Both keep a scrollable list beside the map, and selecting an item in one highlights it in the other.
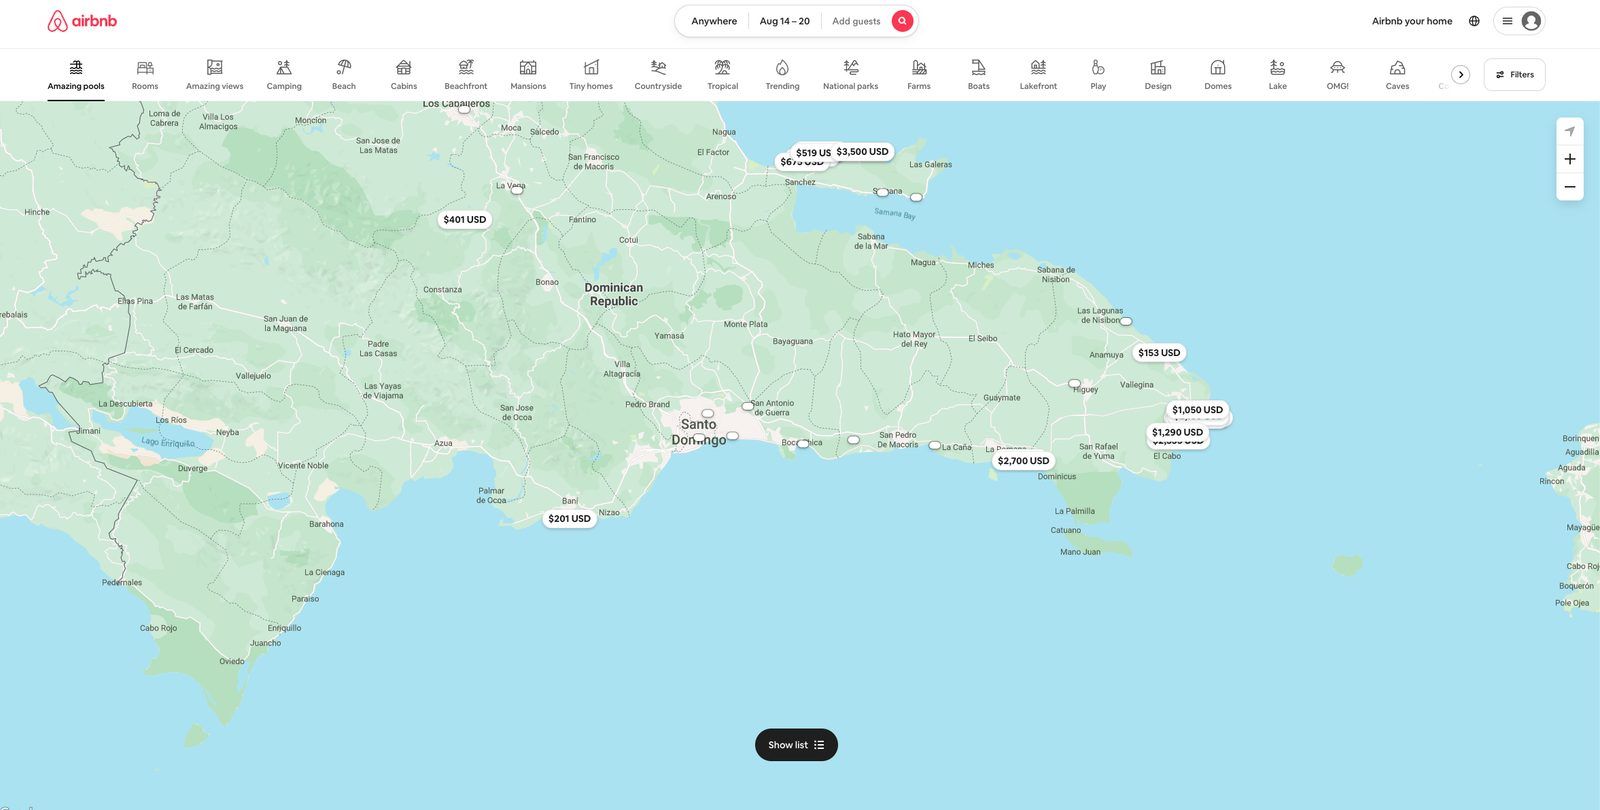
Map, list and split view
Assets, inspections and treatments each have a Map View, List View and Split View. Split view puts compact cards on the left and the map on the right. The view switcher and the condition legend sit in the same place on every screen.
3. Dashboard
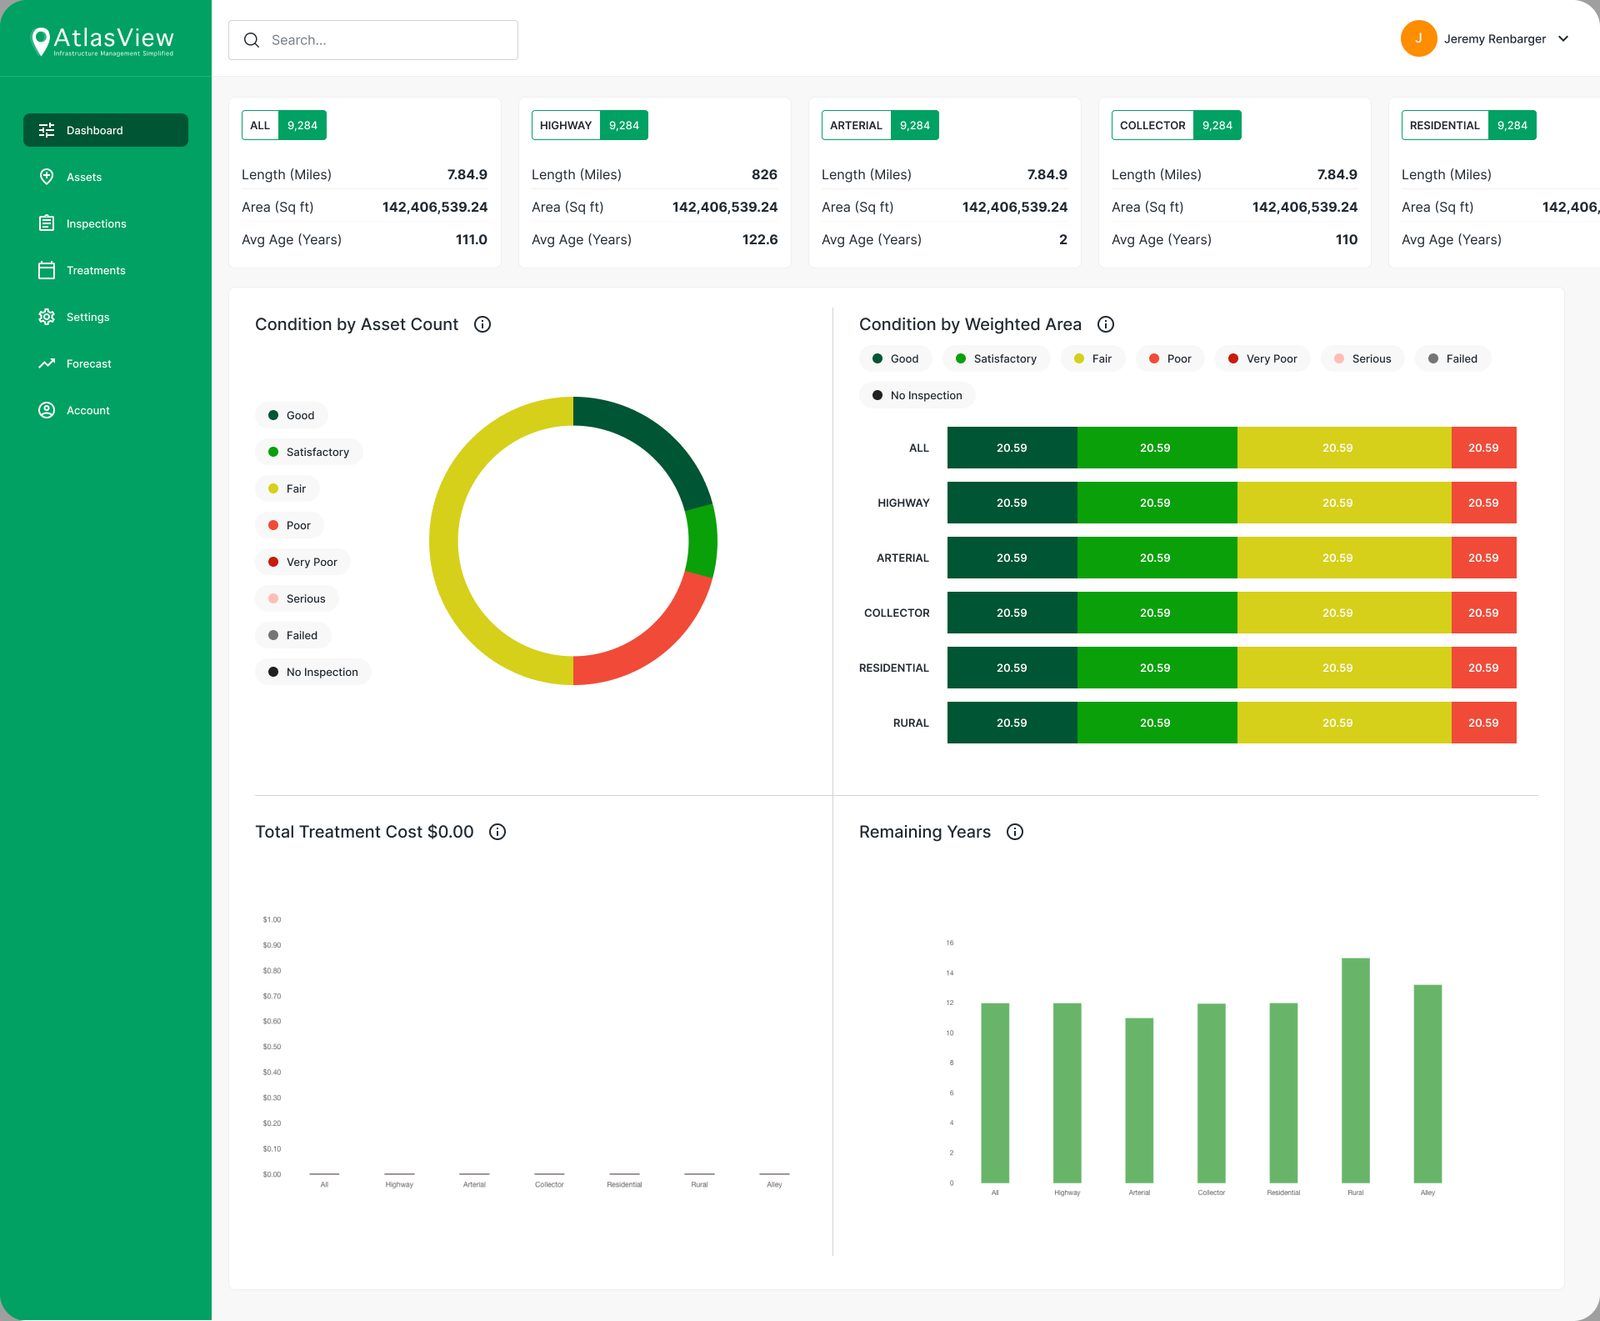
The dashboard shows the condition of the network at three levels. There are summary cards by functional class (all, highway, arterial, collector, residential) with length, area and average age, a chart of condition by asset count, and one of condition by weighted area, which gives a highway more weight than an alley. Treatment cost and remaining years are also there. Each chart has an info icon that explains how it's calculated.
4. Assets
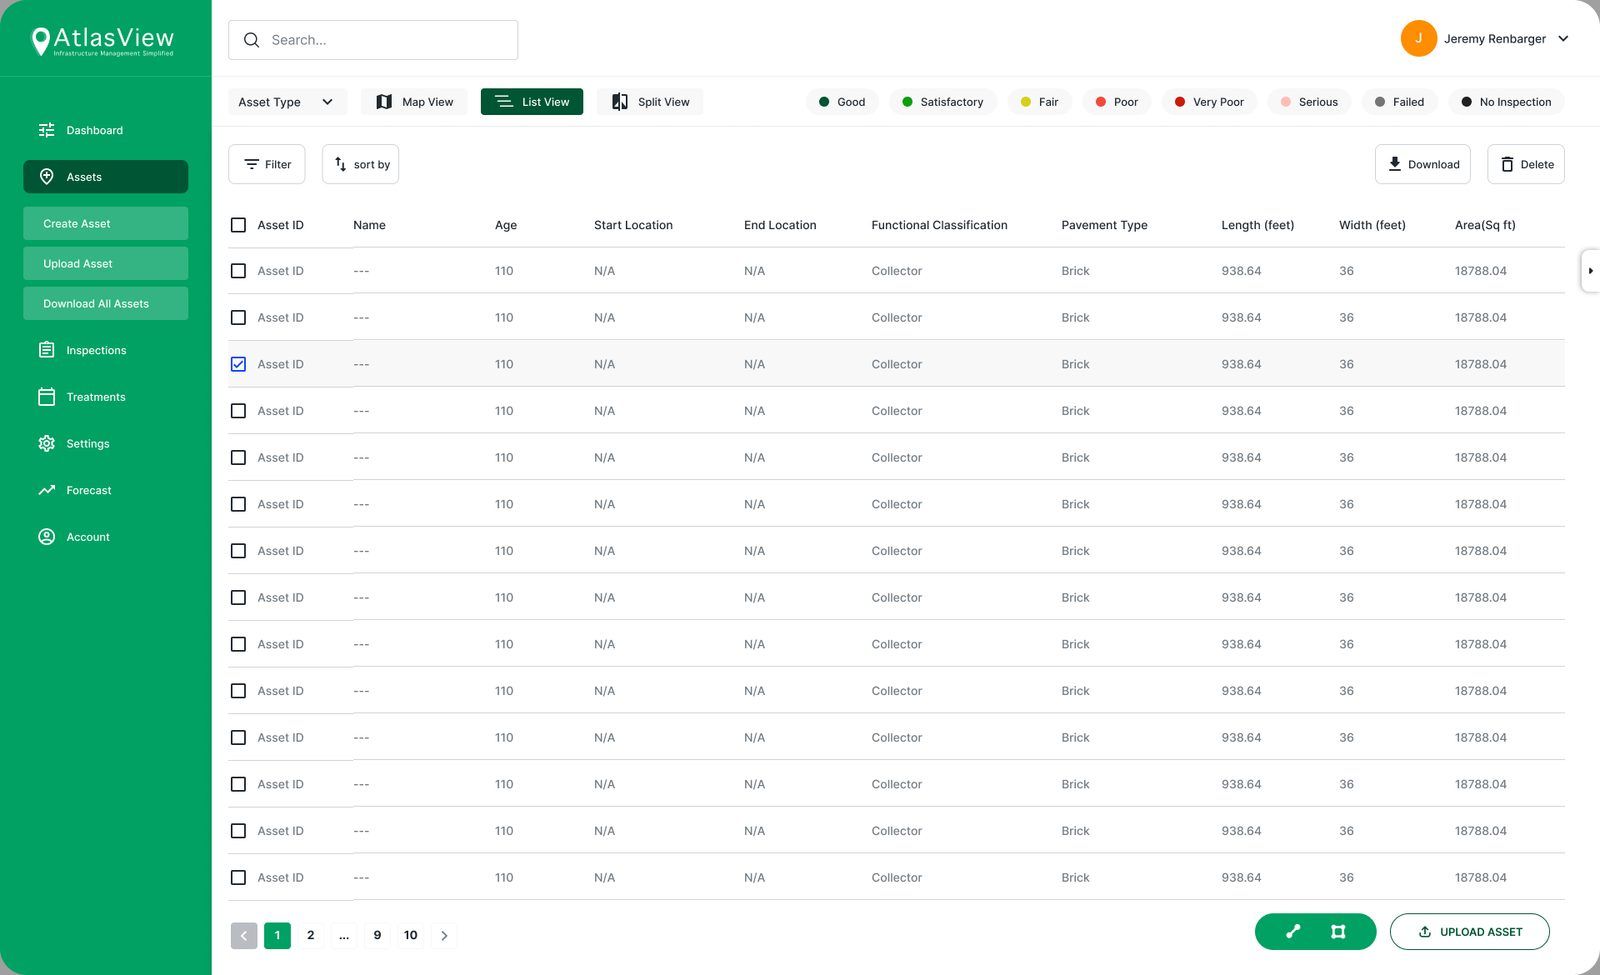
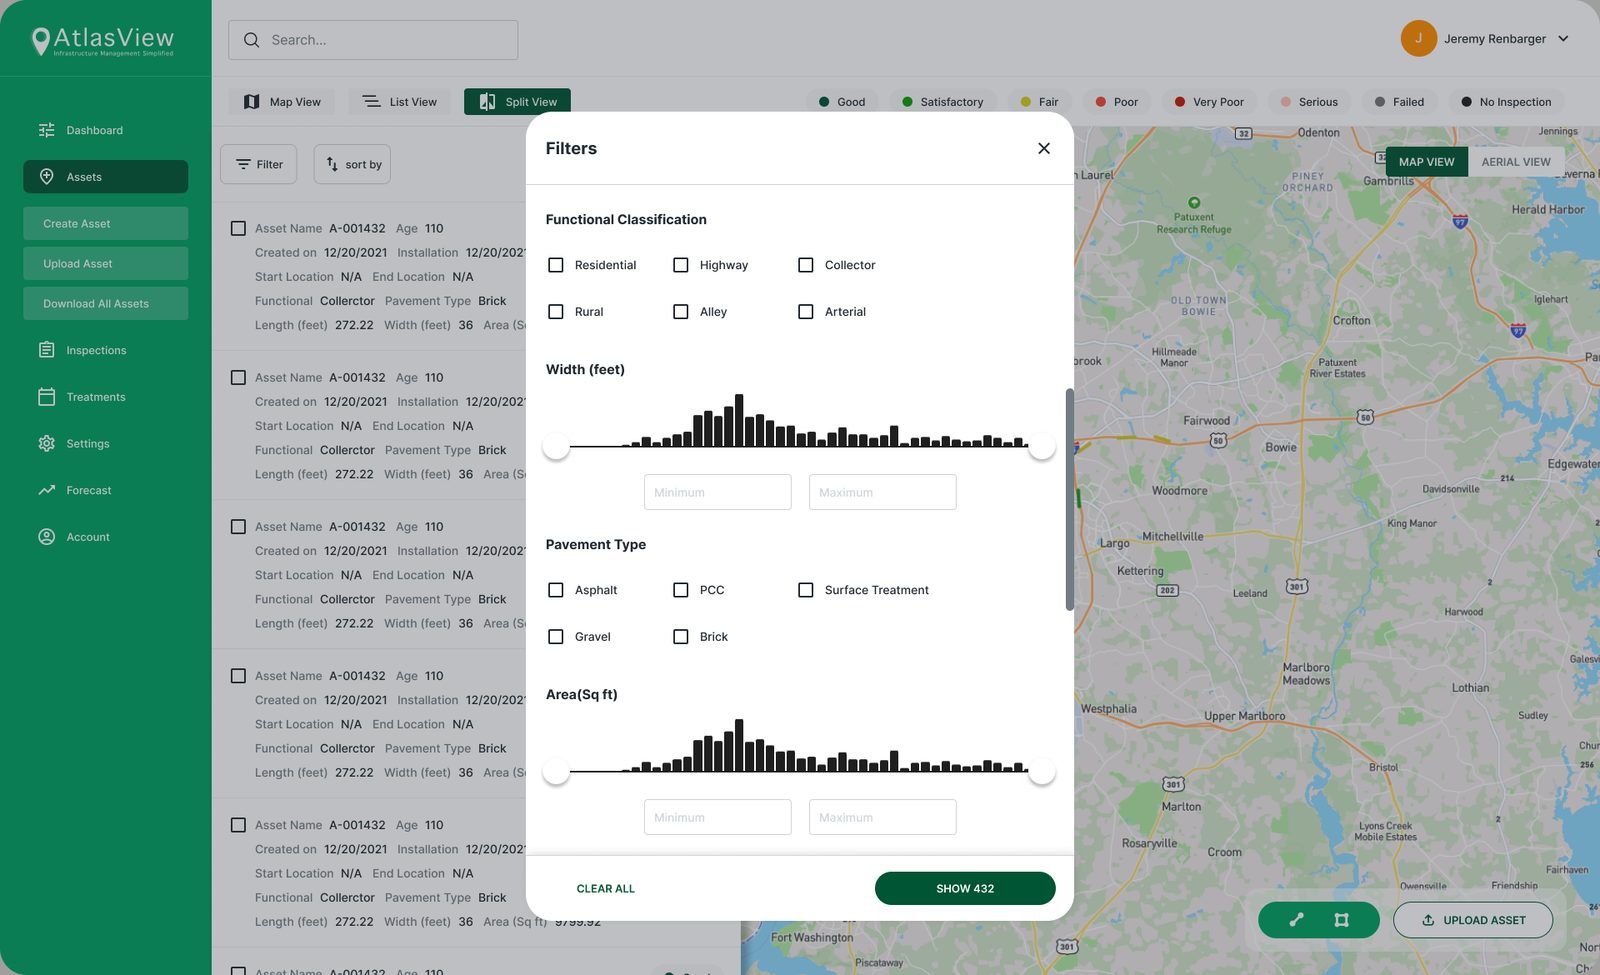
The asset list shows the fields engineers use: ID, age, location, functional class, pavement type and dimensions. The new filters cover what the audit found missing. Users can filter by functional class and pavement type, and set width and area ranges on a histogram that shows how many assets match before applying ("Show 432").
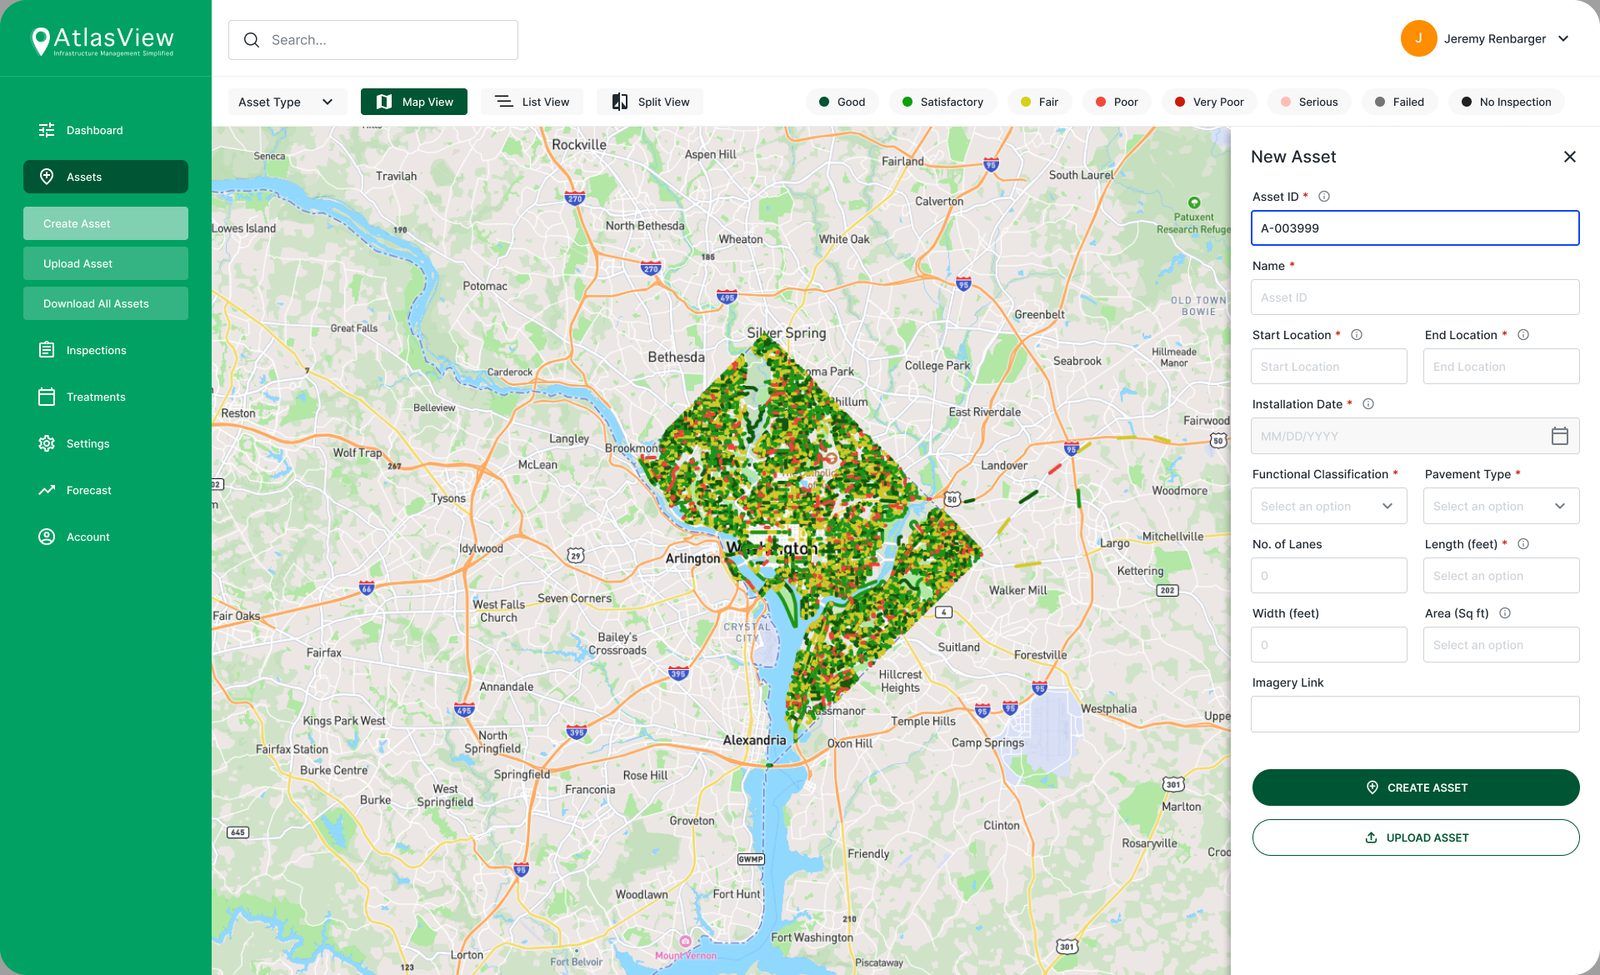
New Asset form in a side panel
Creating an asset now happens in a panel on the right. The map stays visible and interactive while the form is open, and the form keeps what was typed when the user switches to drawing. Required fields are marked, and info icons explain the technical ones.
5. Inspections and treatments
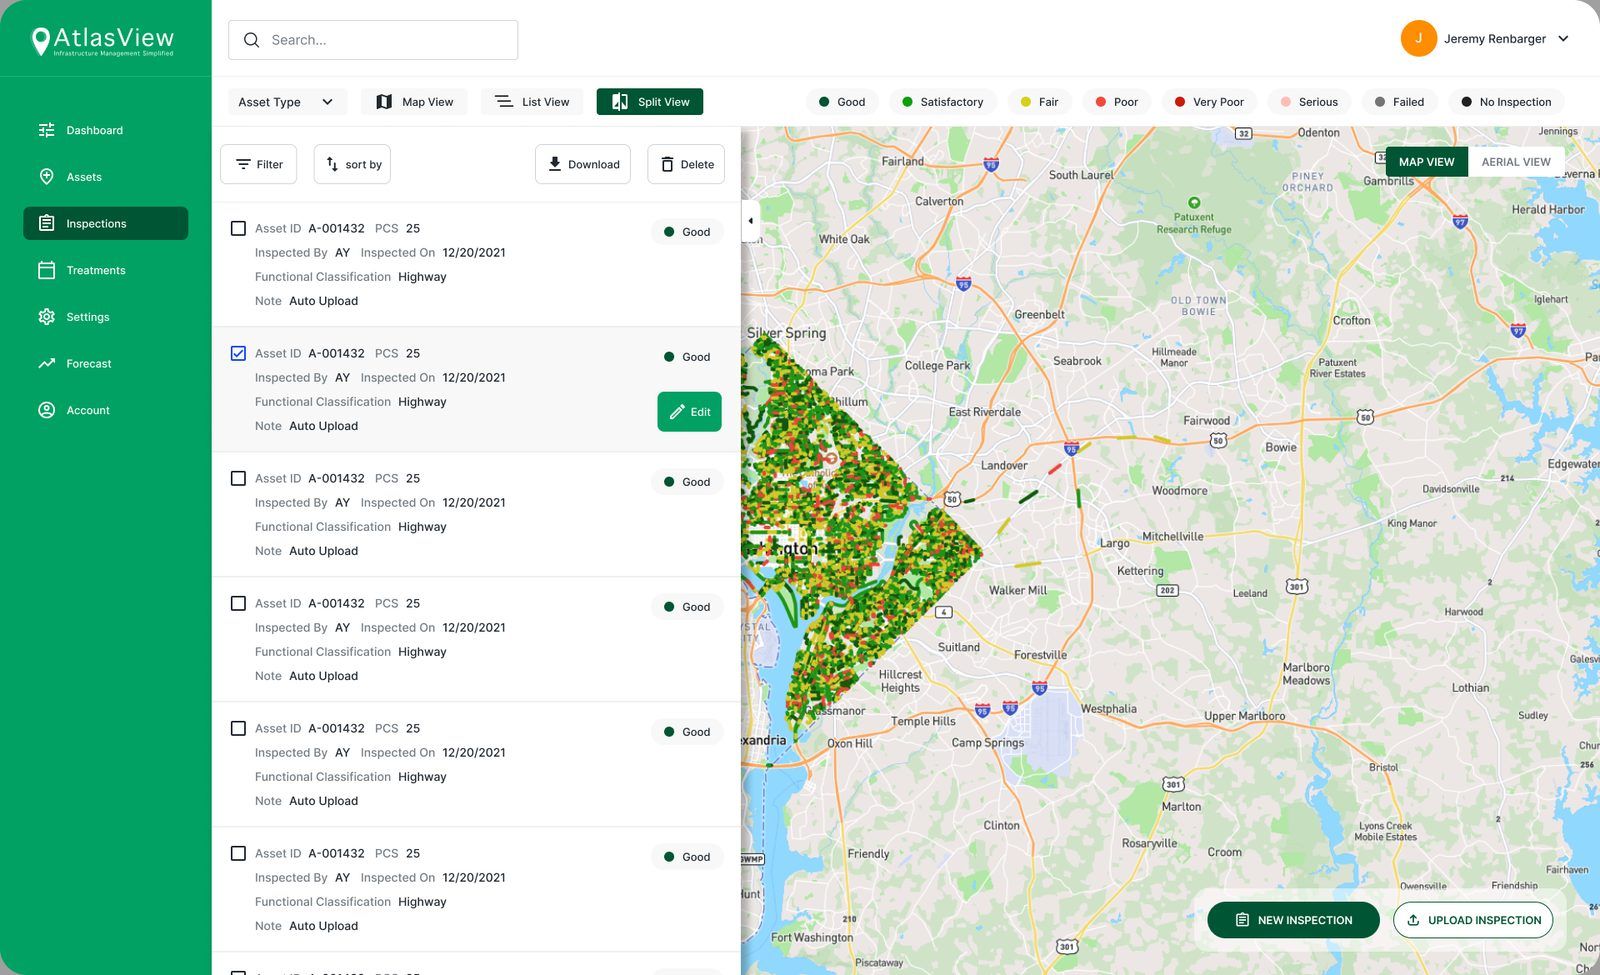
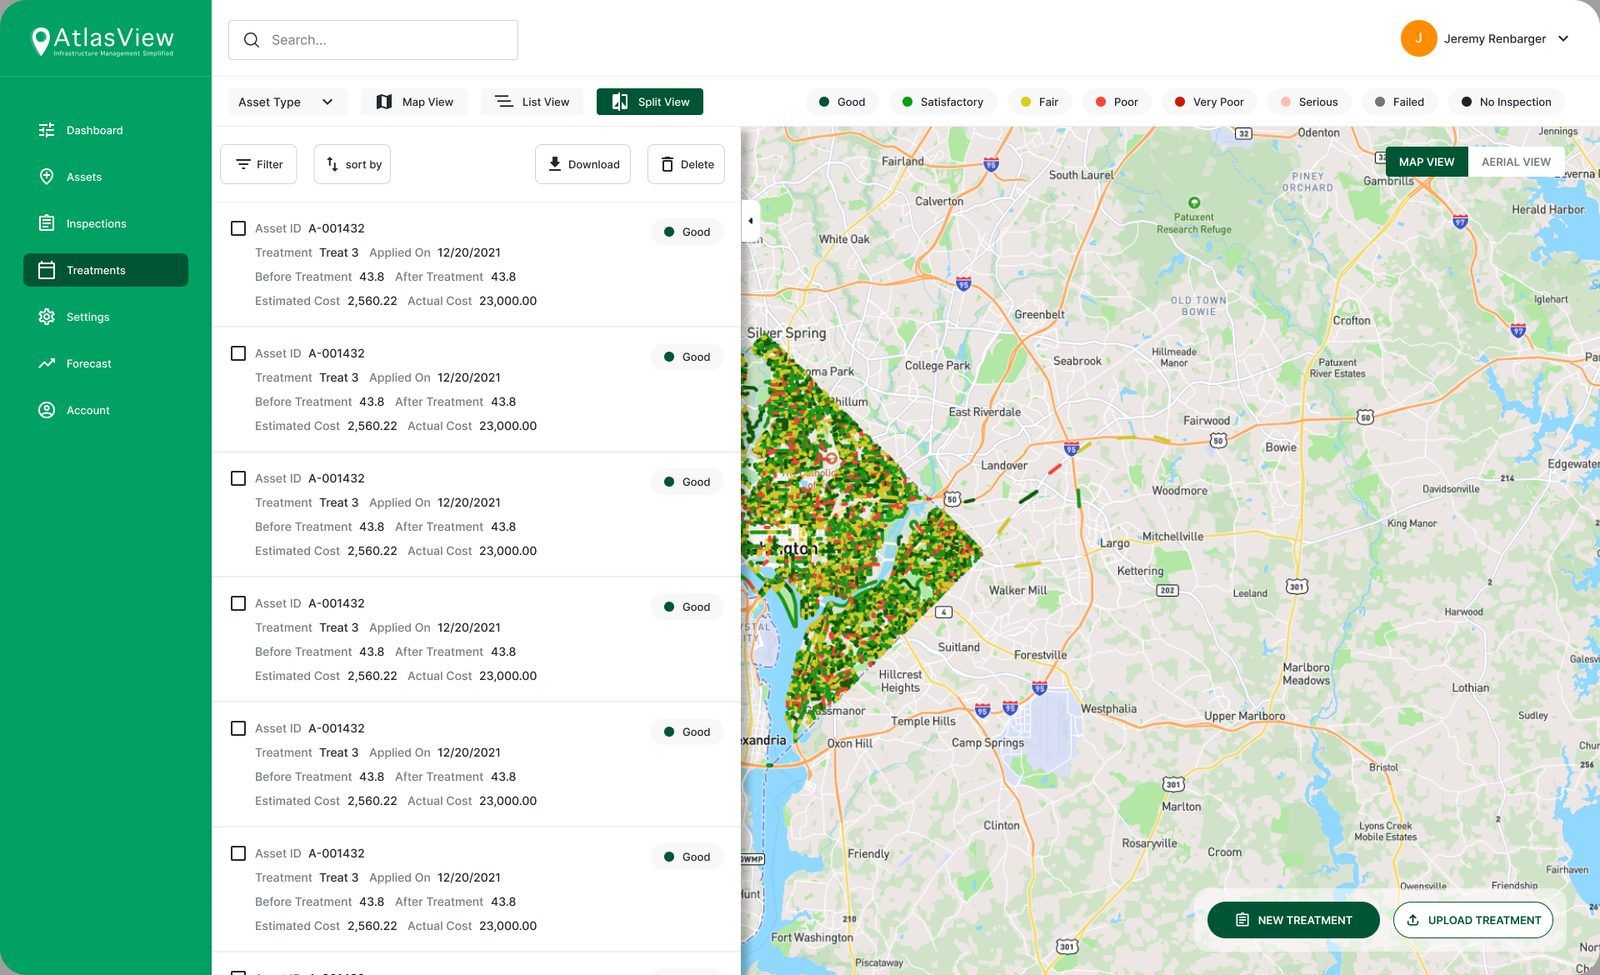
Inspections and treatments use the same split layout. An inspection card shows the asset, its PCS score, who inspected it and when. A treatment card shows condition before and after, and estimated versus actual cost. Bulk actions (download, delete) and the New and Upload buttons are in the same place in every module.
6. Settings
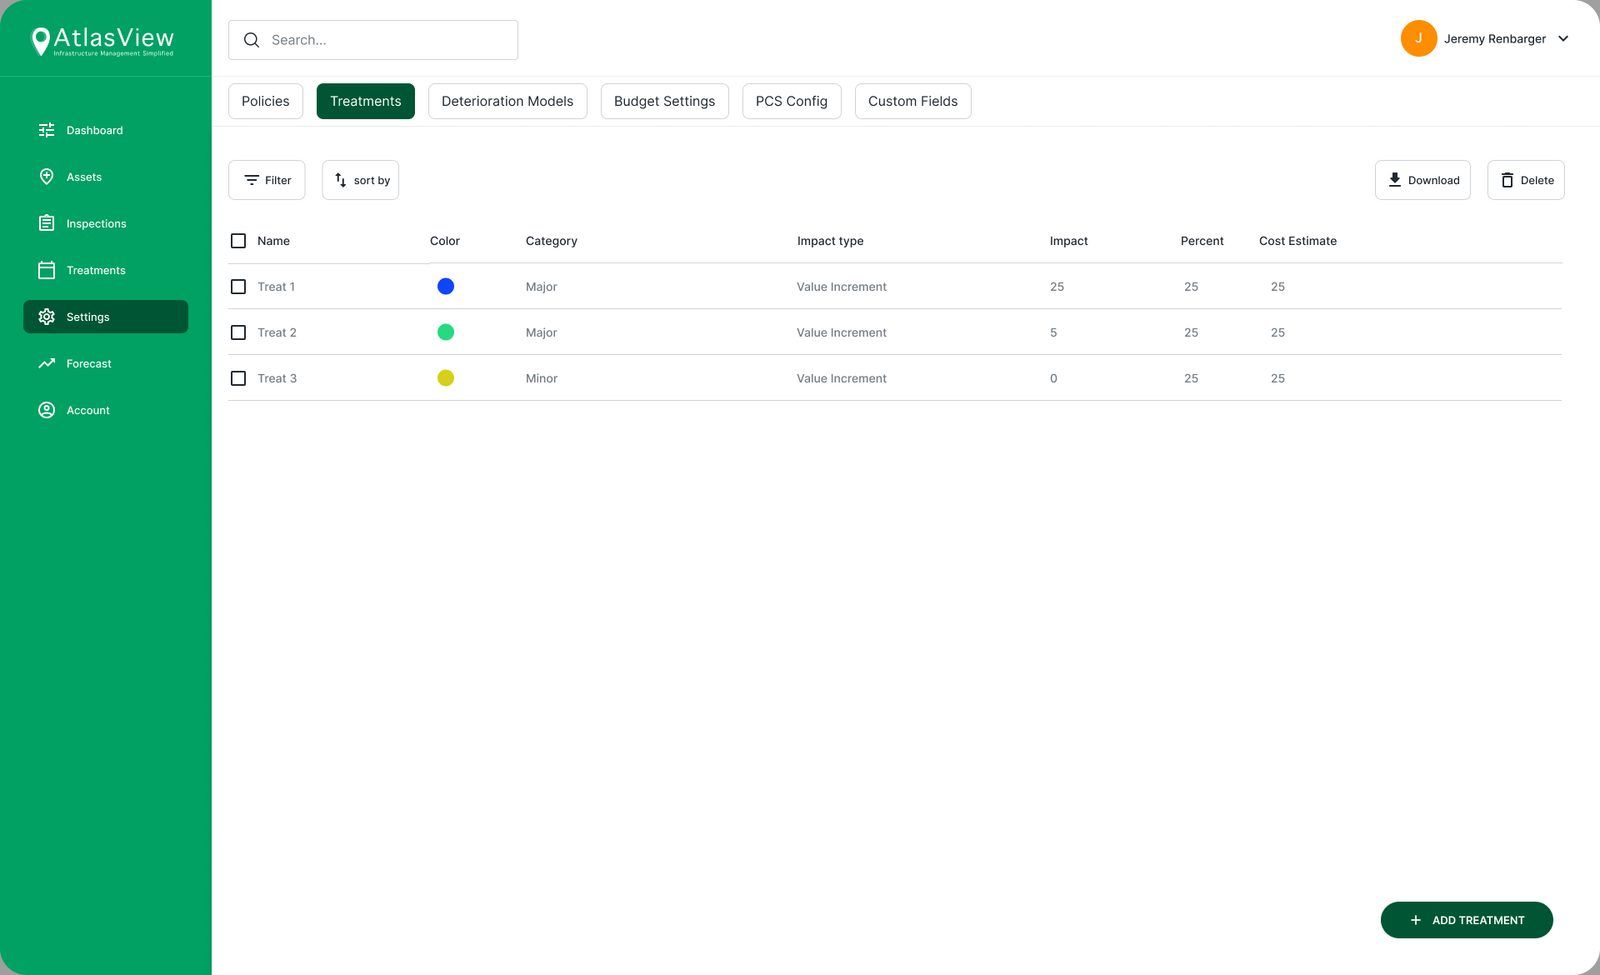
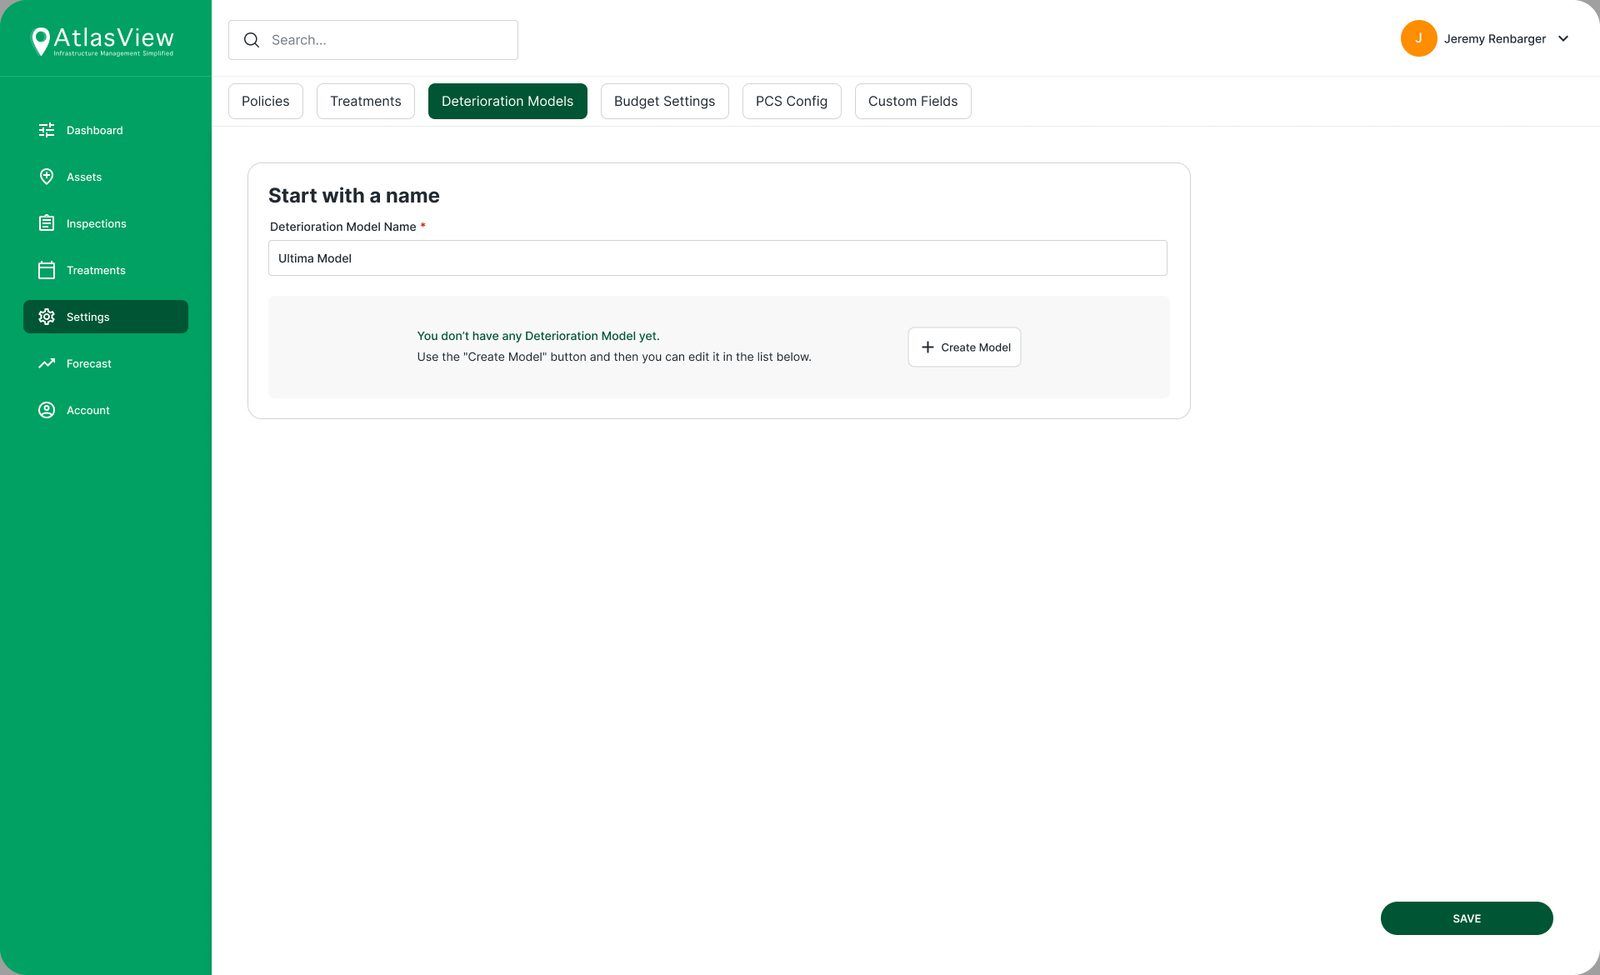
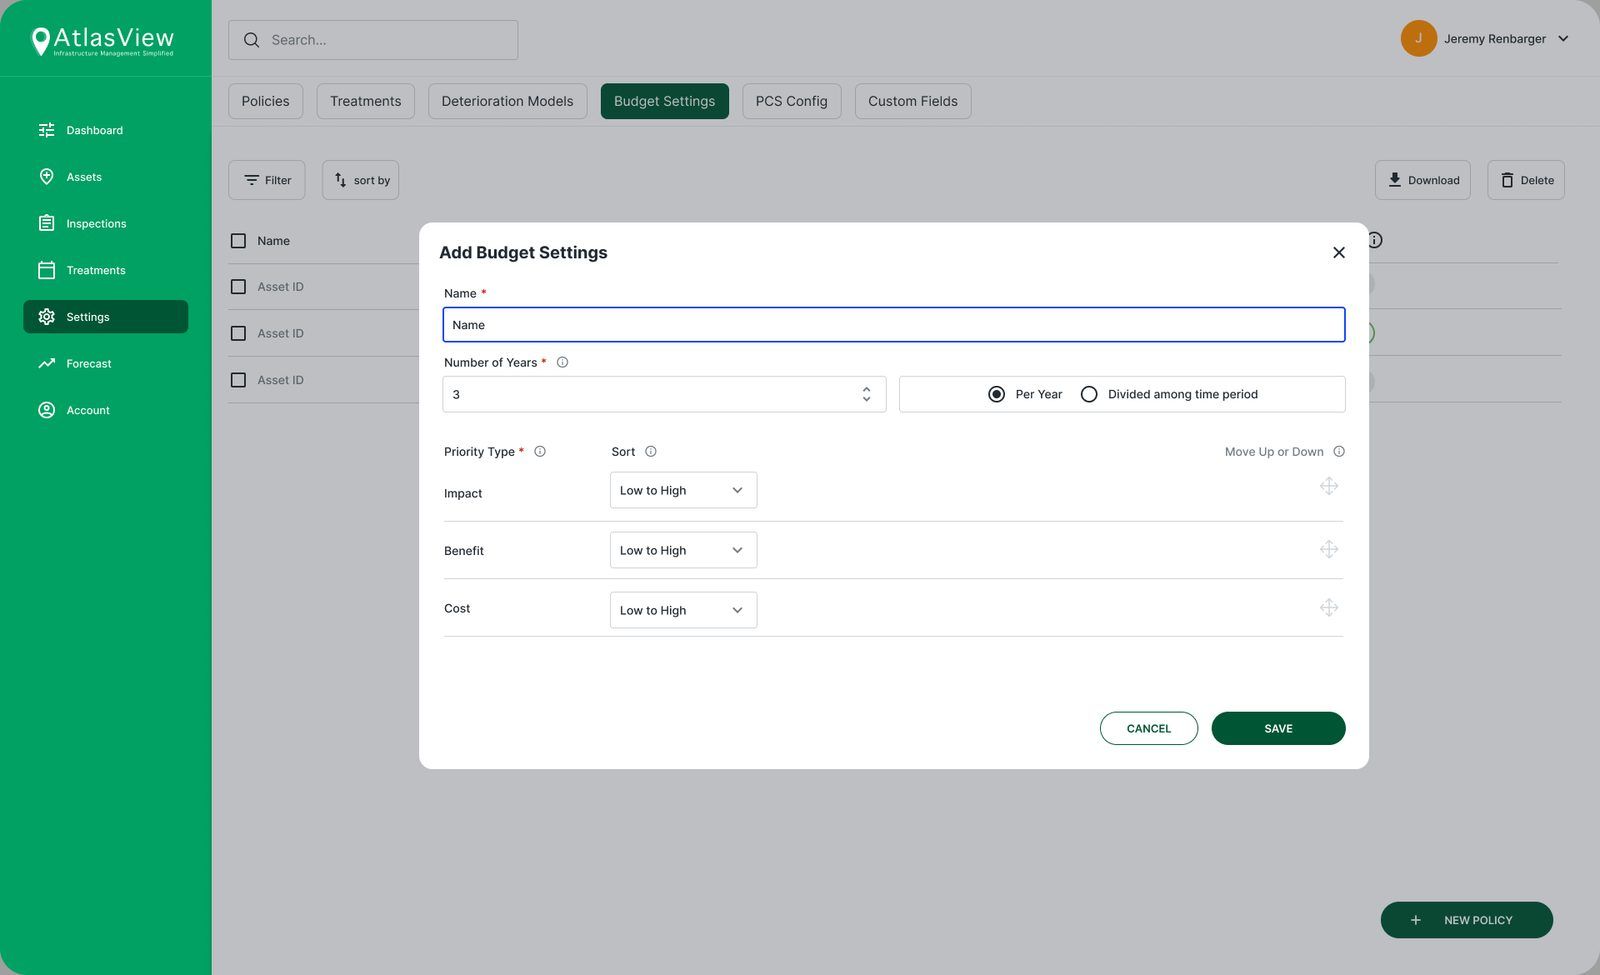
Settings holds the engineering logic: maintenance policies, treatments with their impact and cost, deterioration models, budget rules, PCS configuration and custom fields. I put these screens in tabs with consistent tables. Creating a model became a few guided steps that start with just a name, and each list has a clear empty state.
7. Forecast
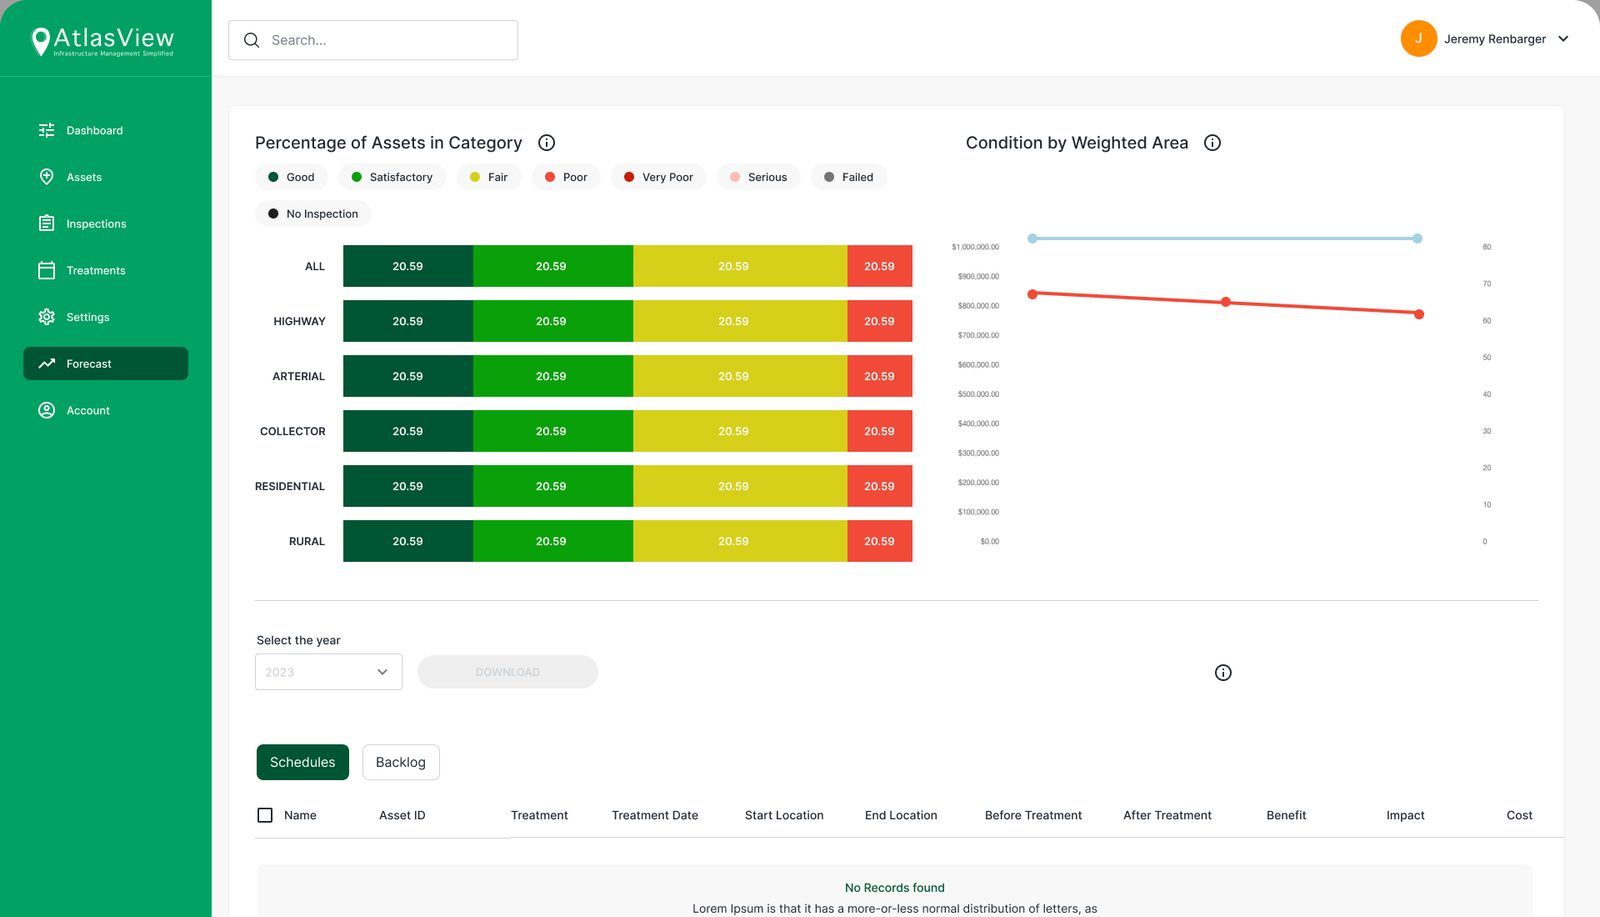
The forecast shows the percentage of assets in each condition category per road class, and how condition by weighted area changes over the years. It also lists schedules and backlog by year, with a download for reports.
AtlasView was a client. I delivered the design and their in-house team built it.